Fellows’ work leads to COVID tracker
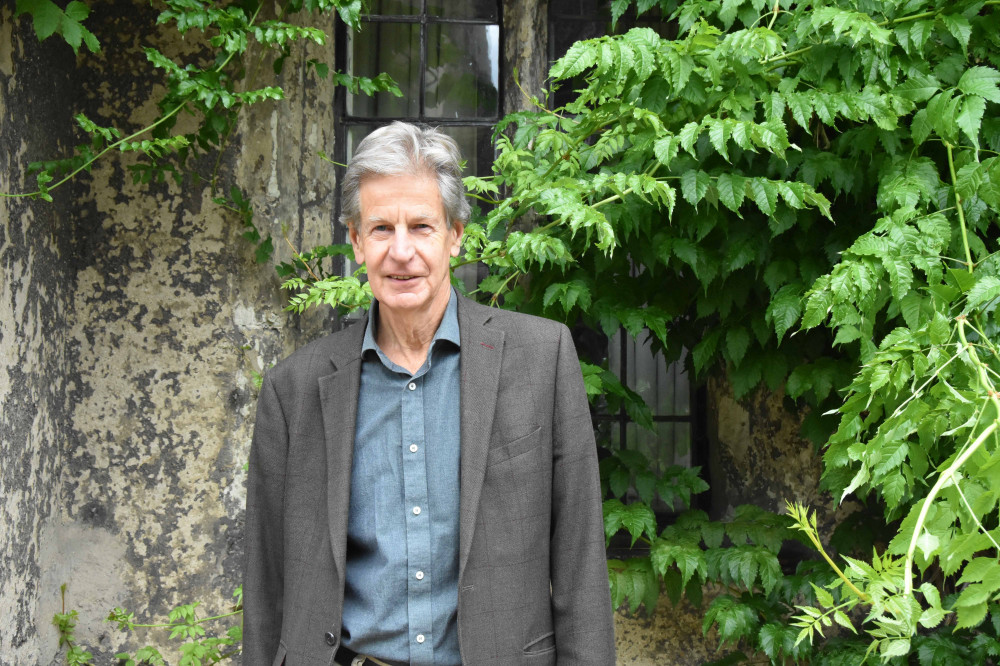
A COVID-19 tracker that has been providing forecasts of the pandemic’s trajectory in India was developed by Fellows of Corpus Andrew Harvey, Emeritus Professor of Econometrics at the Faculty of Economics of the University of Cambridge, and Dr Paul Kattuman, Reader in Economics at Cambridge Judge Business School.
The methodology on which the tracker is based was described in a paper the duo released last summer.
Paul Kattuman explains, “Many years ago, Andrew Harvey (left) wrote a pioneering paper on a new class of models for the time series of how new products diffuse as they get adopted by users. These structural time series models use historical data for estimating parameters and are able to adapt to the trend emerging in the most recent period.
A single wave of an epidemic spreads in ways quite similar to how new innovations spread. There’s an initial phase when the trajectory is exponential; it then stabilizes as most people who were going to adopt it do so over time, and the market comes to be saturated. In a simple case this trajectory forms an S-shaped curve.”
Paul has taught at the Judge Business School since 2002, before which he was in the Faculty of Economics (he has been a Fellow of Corpus since 1999). The Judge has a small but longstanding health operations group, the Centre for Health Leadership & Enterprise (CCHLE) that regularly engages with Public Health England (PHE) and the NHS in the East of England. Although Paul had not been part of the group, its Co-Director Stefan Scholtes asked him to come on board, knowing that his econometric expertise could be helpful to the health agencies struggling to analyse the data they were collecting in the early weeks and months of the pandemic.
Paul says, “I knew I could apply some of Andrew’s methods to the data we were being given by PHE. In the early phase of the COVID-19 epidemic, what began as pre-lockdown chats over lunch in college inspired the extension of Andrew’ basic model to fit the pandemic context -- increasing its flexibility in dealing with daily observations on new cases and deaths. In particular the model was modified so as to adapt to changes in the trend brought about by changes in policies and behavioural response. We began to fit these models in April and May of last year and we found that they worked well in practice. More recently we have been able to show that they can handle recurrent waves of infection.”
Andrew and Paul published a paper describing the method in the Harvard Data Science Review entitled Time series models based on growth curves with applications to forecasting coronavirus.
“The paper was published much more quickly than normal, which was good because it gave some visibility to the model and approach. It gave us the energy to carry on developing the approach and applying it. Of course all the analysis we were doing was pro bono and it was — and still is — a great deal of work.”
Paul has continued doing analyses for PHE based on data from individual hospitals in the East of England. The analysis is fed back to the senior PHE management so they can make operational decisions to help with the intense pressure the health system has been under due to COVID.
The India variant
In February, Andrew and Paul began working with the National Institute of Economic and Social Research in London to use the model in a weekly COVID tracker providing short term forecasts of COVID-19 cases, hospital admissions and deaths for the nations in the UK and regions in England.
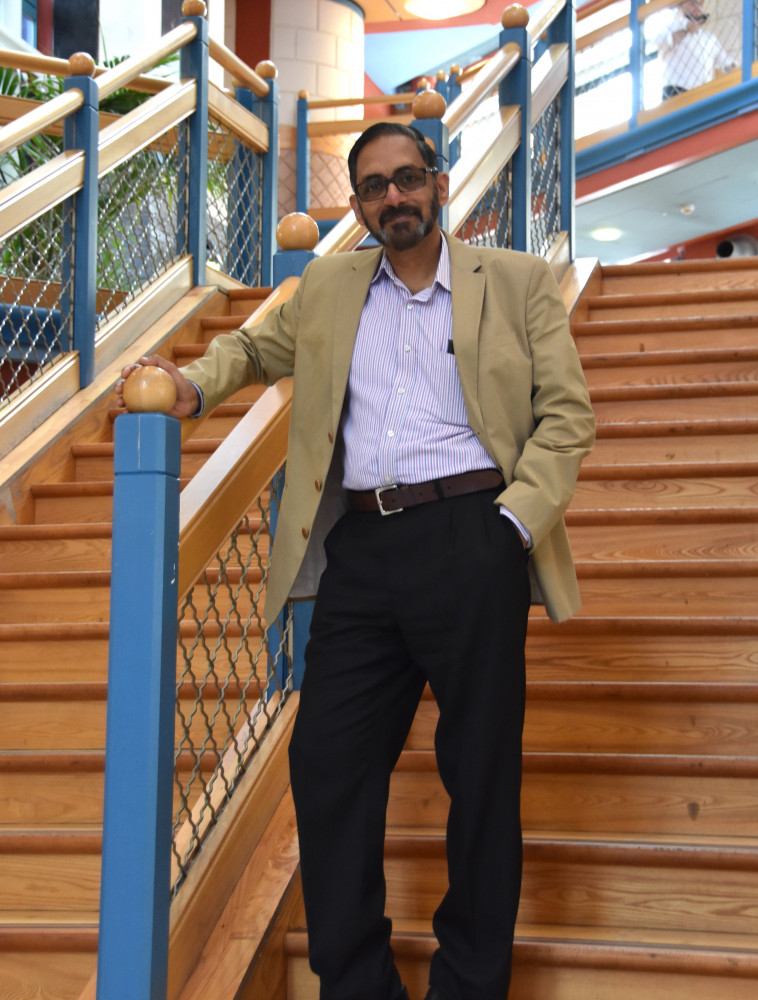
In April, Paul (left) was talking to a classmate from his home province of Kerala in the south of India. That classmate had served as the Chief Secretary for Health in Kerala government and had been appointed COVID advisor to the Chief Minister. They quickly saw the value of using the model to track the development of the pandemic in India, particularly as the second COVID wave was beginning to look alarming.
“The application of the model to India was very timely. In early May, we were able to forecast the imminent peak of the wave in India, before it occurred. This gave confidence that the method would be helpful both for tracking and for forecasting the pandemic curve in India and its 36 states and union territories.”
The India Tracker was developed by the Judge and the National Institute of Economic and Social Research working with Health Systems Transformation Platform in India, as part of a pandemic monitoring series devoted to India to identify areas at high risk of infection increases.
The Tracker analyses data by region and provides short term forecasts of the trajectory of the pandemic, identifying states and union territories that are at risk of increases in infection incidence. The results are published once a week on the Judge website.
The tracker has been quite accurate, with the mean absolute percentage error in forecasts for India ranging between 2% and 7% so far. A number of state governments in India – including Punjab in the north, and Tamil Nadu in the south – have requested help with district-level forecasts for effectively planning their COVID policy and operations. More Indian states are now following suit.
New waves and future epidemics
 Paul and Andrew (left) are seeking funding to make the estimation method available to public health analysts the world over.
Paul says, “This pandemic has many more questions to ask. This software package could extend to other functions than forecasting. We are hoping to use it to identify flareups in specific regions, for instance, or within age bands. And of course, we have not seen the last epidemic.”
“The method has proved its value; we have a strong proof of concept”, he says. “But it will take some time to create a fully documented, roadworthy, open-source software. We are hopeful that we can secure the funding we need to reach that goal.”